
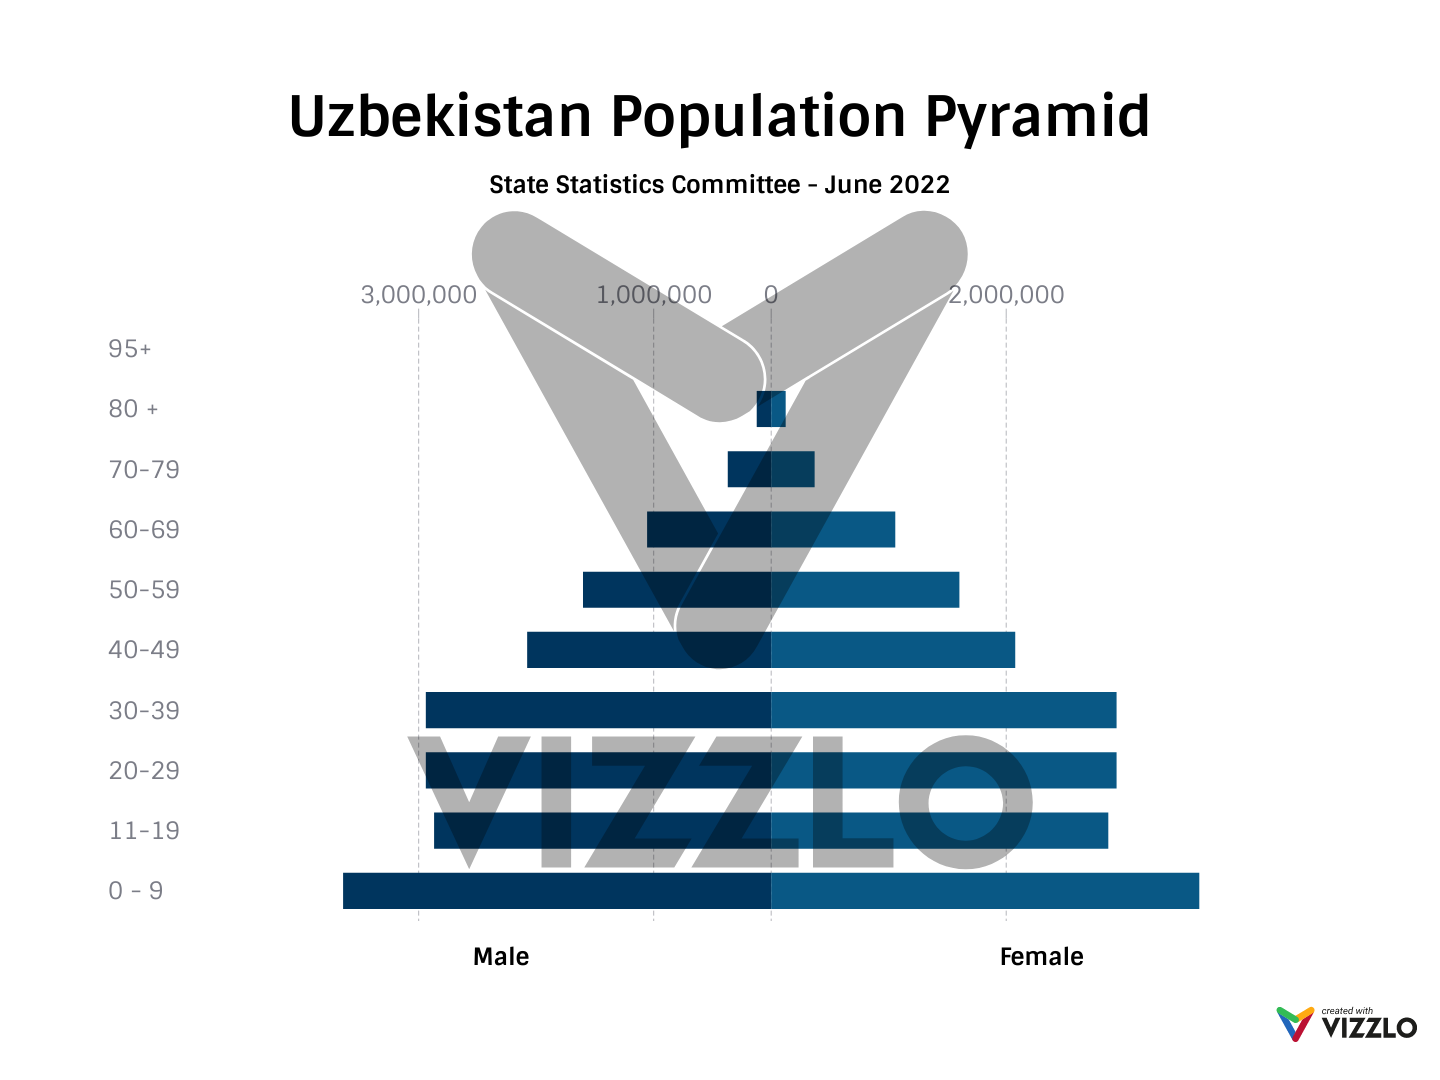
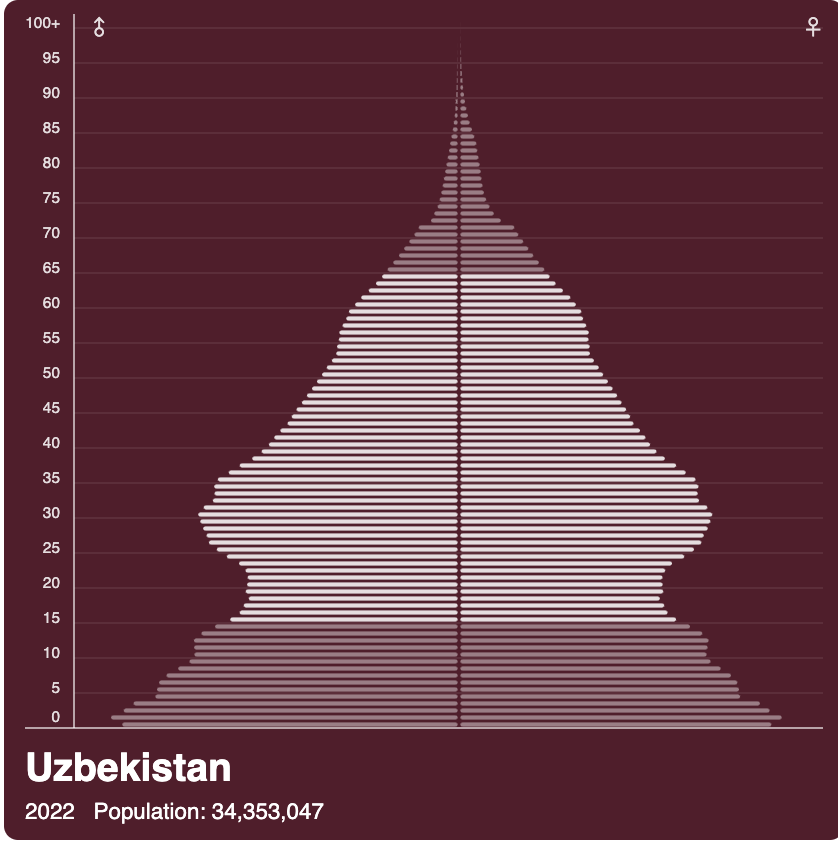
This summer, I have been interested in demographics and the role it plays in the culture, economy, education, and future implications. What sparked my interest was the release of population data last month from the Uzbekistan State Statistics Committee. I used Vizzlo to convert the data into a population pyramid. Uzbekistan is a very young country, and as you can see, the bulk of the population is under 40, and very few older people. I was especially taken aback by the fact that 60% of the population is under 30 years old. The total population of Uzbekistan is between 34-35 million people so that is over 15 million young people. No wonder there were fewer deaths in Uzbekistan than in more developed countries.
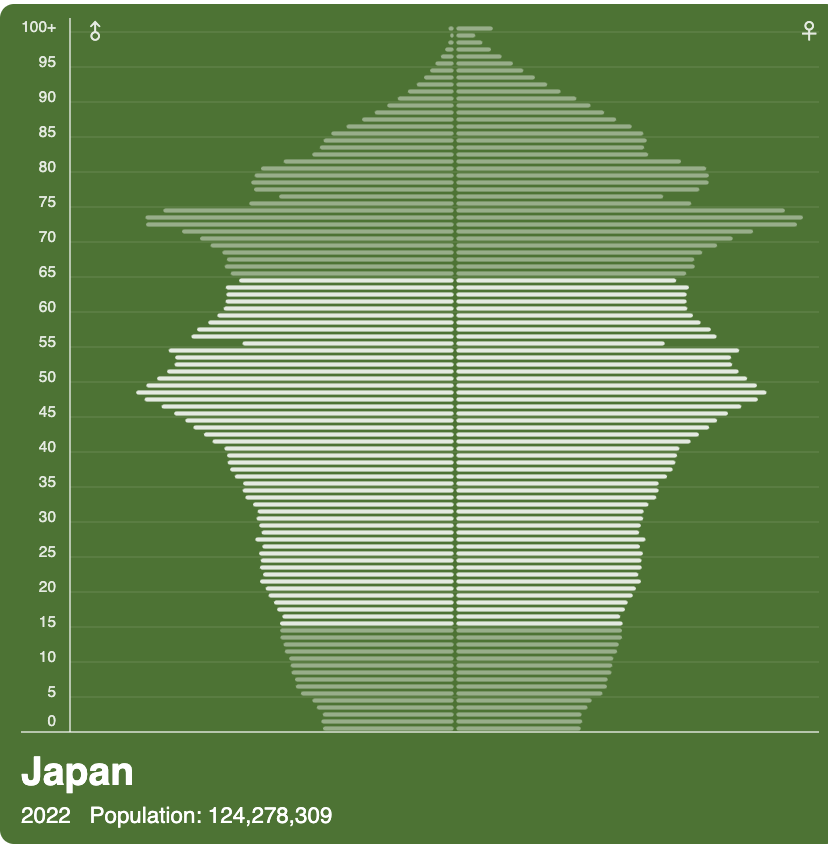
The demographics in Uzbekistan are much different from my previous school in Osaka, Japan, and much of the Western, industrialized, developed world. As you can see below in the pyramids from Population-Pyramids.net, the Japanese population pyramid looks much different and presents countries with different challenges. In Uzbekistan, the problem will be finding jobs for the big cohorts moving through working age, especially the 0-9 cohort. Japan is in trouble because it will have a decreasing number of working people to support a top-heavy, retired cohort. The USA looked like Uzbekistan in the 1950s and 1960s, but fortunately, through immigration, the USA has been able to have a stable cohort of younger workers coming up through the system, unlike Japan.

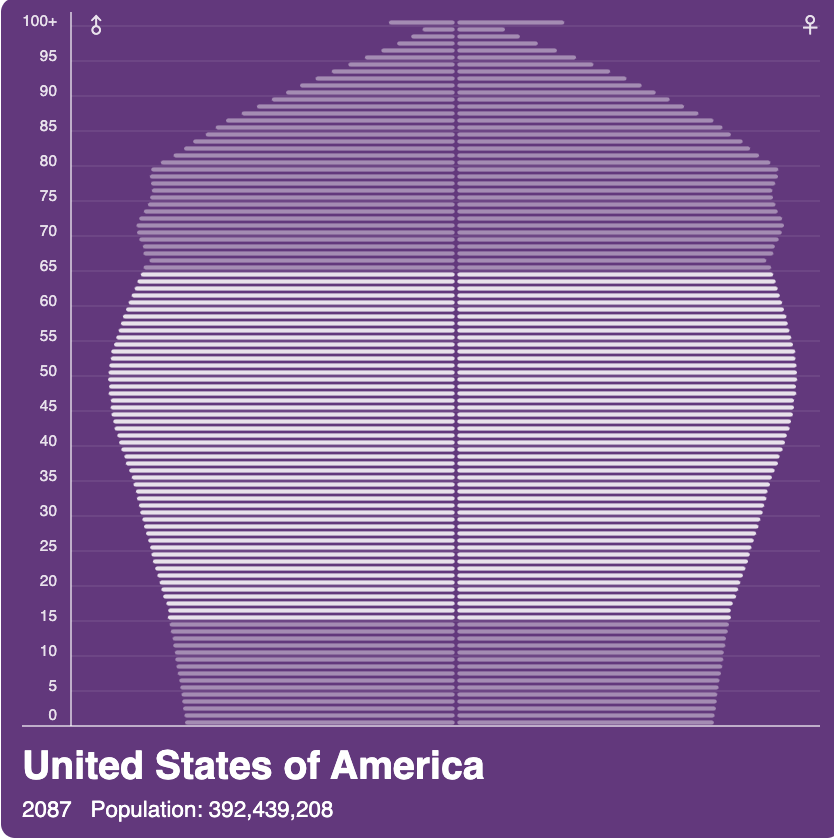
I also listened to the Sam Harris podcast interview with Ian Bremmer and Peter Zeihan “The End of the Global Order.” Bremmer and Zeihan are experts in global politics and they both said China is in trouble because the 1-child policy has warped their population pyramid. They will be facing a huge retirement cohort and few workers to support them. The population will be half (700 million) in 2100 what the population is today. The population pyramid website that a neat feature that projects the populations into the future. Here are some countries in the year 2087. I picked 2087 because that is the peak year of retirees in China. Looking like a mushroom is not good. It will be fascinating to see how humanity reacts to declining populations in most nations over the next couple of centuries.


Microsoft billionaire Steve Ballmer’s USA Facts has a lot of good demographic data for the USA. The USA increased population from 2010-2020 by 7% overall. The increase was uneven with gains in the south, Texas, LA, Phoenix, Miami and North Carolina and losses in the north, Detroit, Illionis, Pittsburgh, Long Island. People are moving to warmer weather with the exceptions of Denver and Seattle. I was curious to see that in the 2020 census, 60% of Americans (197 million) are white. The next largest groups are Latinos (61 million), African-Americans (38 million) and Asians (15 million). My home state of Michigan increased 1%, although the Upper Peninsula (UP) lost population. Iron County, where I am from, lost .3% over the last 10 years, and is down to 11,000. The peak of Iron County was during the iron ore boom years and the 1920 census counted over 22,000. Iron County is projected to lose even more over the next 10 years as over 30% of population is 65 years or older. This is in contrast to the US average of 17% 65+ cohort. The most populous and economically viable county in the UP is Marquette. They only lost 1.6% and has a population of 65+ at 20%.
